I Built an AI SOC Analyst in n8n That Triages Wazuh Alerts For Me — Here’s Every Node, Explained
2026-05-31 · NeetroX
If you’ve ever run a SOC — or even just a Wazuh box exposed to the internet — you know the feeling. You open your alerts in the morning and there are 400 of them. Most are noise. A few are real. And the one that actually mattered is buried on page 7 behind a hundred “failed password for invalid user” lines.
I got tired of being the human filter. So I built one in n8n.
The idea is simple: Wazuh fires an alert → it hits a webhook → the workflow enriches it with threat intel, pulls related logs straight from the Wazuh Indexer, asks an AI to write a proper incident report, optionally blocks the attacker, pings me, and files the paperwork. All in about 7 seconds. While I drink coffee.
This post is the full tour. I’m going to walk you through every node, in the order the data flows, and tell you not just what each one does but why it’s there — including the parts that bit me along the way (looking at you, Cloudflare). Grab a coffee of your own. This is a long one.
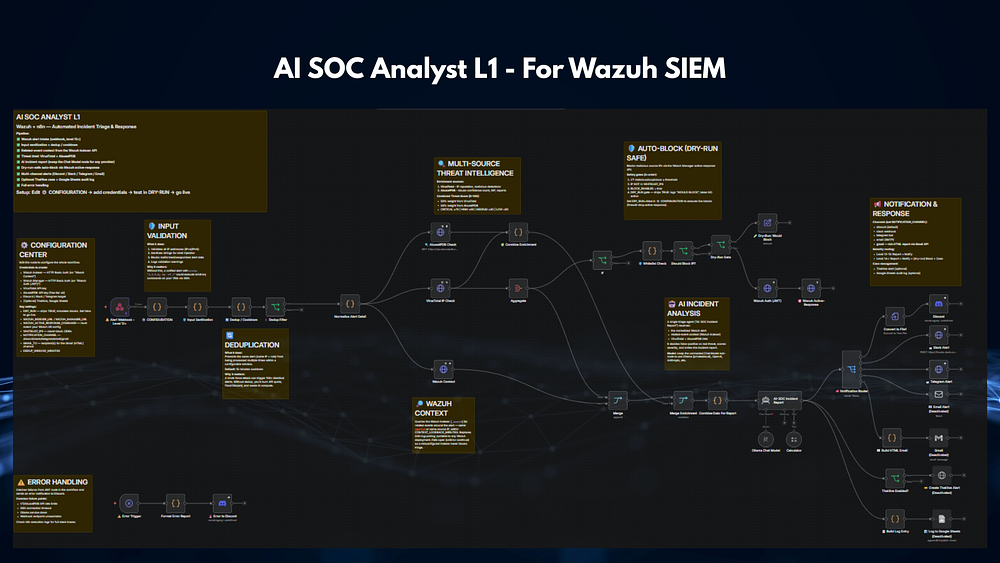
Here’s the 30,000-foot view before we dive in:
Alert → Guardrails → Enrichment → AI triage → Response → Notify → Log → (and an error net under the whole thing)
Let’s go.
Stage 1 — Catching the alert
Alert Webhook — Level 12+
This is the front door. It’s a plain webhook listening on POST /reportlvl12. I configured Wazuh's integrator to fire any alert at level 12 or higher straight at this URL as JSON. The node answers immediately with a 200 so Wazuh isn't left hanging while the heavy lifting happens downstream — a small thing that saves you from weird timeouts later.
CONFIGURATION
If there’s one node to fall in love with, it’s this one. It’s a single Code node that holds every setting for the whole workflow — Wazuh URLs, API thresholds, the whitelist, your notification channel, the dry-run switch, everything. Nothing else in the workflow has hardcoded values; every other node reaches back here and asks “hey, what’s the indexer URL?” That means setup is “edit one node, done” instead of clicking through 30 of them. Future-you will thank present-you.
Stage 2 — Guardrails (before we trust anything)
A security tool that blindly trusts its input is a security vulnerability. So before the alert goes anywhere, it runs a gauntlet.
Input Sanitization
This validates the source IP (real IPv4/IPv6?) and strips shell metacharacters out of every field. Why? Because somewhere down the line we might feed values into commands, and an attacker who can get srcip: "1.2.3.4; rm -rf /" into an alert should not get to run that. This node is the bouncer that pats everyone down at the door.
Dedup / Cooldown
A brute-force attack doesn’t fire one alert — it fires hundreds of identical ones. Without protection, you’d burn your VirusTotal quota, spam your Discord, and melt your LLM in five minutes. This node remembers what it’s seen (keyed by IP + rule + agent) and suppresses repeats inside a configurable window (15 minutes by default). It’s the difference between “one tidy notification” and “your phone vibrating off the desk.”
Dedup Filter
The traffic light right after dedup. If the alert is flagged PROCESS, it moves on. If it's a SKIP (a duplicate), it quietly stops here. Clean and simple.
Normalize Alert Data1
Wazuh alerts come in two shapes depending on how they’re forwarded — sometimes the good stuff is at the top level, sometimes it’s nested under full_alert. This node flattens both into one consistent structure so every downstream node can just say body.agent.name and not care how the alert arrived. Boring node, enormous quality-of-life win. (Fun fact: an earlier version only ran this on one branch, which silently broke half my alerts. Normalizing everything, every time fixed a bug I didn't even know I had.)
Stage 3 — Enrichment & context (who is this, really?)
Now we fan out and gather intelligence from three sources in parallel.
VirusTotal IP Check
Looks up the attacker’s IP reputation across ~90 engines. “11 out of 43 flagged this as malicious” is a great signal to hand an analyst — or an AI.
AbuseIPDB Check
The second opinion. AbuseIPDB gives an abuse-confidence score, the ISP, usage type, and how many people have reported this IP. (Pro tip from personal pain: AbuseIPDB’s v2 API key is different from the v1 key — paste the wrong one and you’ll get a cheerful 401 forever.)
Wazuh Context
This is my favorite node, and the one that took the longest to get working. Instead of SSH-ing into boxes to grab logs (the old, fragile way), it queries the Wazuh Indexer directly with a _search — "show me everything related to this agent or this IP in the last hour." Suddenly the AI doesn't just see one alert; it sees that the same host has been getting hammered by SSH brute-force from five other IPs all morning. Context is everything. (Big lesson here: I originally pulled the entire alert documents back — 218 KB of JSON for the LLM to choke on. Adding _source field-filtering so the Indexer only returns the 8 fields I actually use cut that to a few KB. Don't make your LLM read a phone book.)
Aggregate
A small utility that rolls VirusTotal’s detection stats into a tidy array so the “should I block?” logic downstream can read it cleanly.
Combine Enrichment
Takes VirusTotal + AbuseIPDB and fuses them into a single Combined Threat Score (0–100) with a label — LOW / MEDIUM / HIGH / CRITICAL. Half the weight comes from each source. This is the number the AI uses to “weight” its judgment.
Merge & Merge Enrichment
These two are the plumbing — synchronization points that wait for the parallel branches (threat intel + Wazuh context) to all finish before moving on. Not glamorous, but without them you get race conditions where the AI runs before the data arrives.
Combine Data For Report
The packer. It assembles one clean object for the AI: VirusTotal stats, AbuseIPDB summary, the combined score, the flattened alert, and the Wazuh context boiled down to the top 12 most-recent related events (each trimmed to a readable one-liner). This is the exact “briefing packet” the analyst gets.
Stage 4 — The AI analyst
Ollama Chat Model
The brain. I run a local model through Ollama so alert data never leaves my network — kind of important when the “data” is your own security incidents. The beauty of n8n’s agent pattern is this is a swappable Lego brick: don’t want local? Unplug it and drop in OpenAI or Anthropic. The rest of the workflow doesn’t care.
Calculator
A little tool the agent can call if it needs to do math (scoring, time deltas, that kind of thing). Small, but it keeps the model from fumbling arithmetic.
AI: SOC Incident Report
The star of the show. This is a LangChain agent with a system message that tells it exactly who it is: “You are a tier-1 SOC analyst. Here’s the alert, the related events, and the threat intel. Decide if it’s a false positive, score the severity, and write a tight incident report. Don’t invent anything.” The output is genuinely good — it spots the attack type, pulls the secondary payload IP out of a Shellshock command, maps it to MITRE, and lists containment steps. The thing I’d normally spend 15 minutes writing, it writes in 5 seconds.
Stage 5 — Deciding whether to fight back (carefully!)
This is the part that can take down production if you get it wrong, so it’s wrapped in layers of “are you sure?”
If (threat gate)
First question: did VirusTotal actually flag this IP as malicious or suspicious? If not, we don’t even consider blocking. No reputation hit, no block.
Whitelist Check
The “don’t shoot your own foot” node. It checks the IP against a configurable list of safe ranges (your RFC1918 internal networks, your DNS resolvers, etc.). Blocking 8.8.8.8 because someone spoofed it would be a very bad morning.
Should Block IP?
A clean yes/no gate combining the above: malicious and not whitelisted and blocking enabled.
Dry-Run Gate
The single most important safety feature in the whole build. It reads DRY_RUN from the config, which ships set to true. On its first day in your environment, this workflow will tell you what it would block and touch nothing. You watch it for a week, build trust, and only then flip the switch. No surprise outages.
Dry-Run: Would Block
When dry-run is on, the request lands here — a node that simply records “WOULD BLOCK 192.159.99.95 via firewall-drop on agent 005” and stops. All the decision-making, zero of the consequences.
Wazuh Auth (JWT)
When you do go live, blocking happens through the Wazuh Manager API, which needs a token first. This node authenticates and grabs a fresh JWT (they expire every ~15 minutes, so we fetch one each time rather than hardcoding).
Wazuh Active-Response
The hammer. It calls the Manager’s active-response API to run firewall-drop on the agent, dropping the attacker's IP at the host firewall. This is the "automated" in "automated response" and it only ever runs if every safety gate above said yes.
Stage 6 — Telling the humans
A report nobody reads is useless. The Notification Router is a switch that sends the report to whichever channel you picked in config. I built five:
Convert to File1 → Discord
For Discord, I convert the report to a text file and post it through a webhook — keeps long reports readable instead of getting mangled in a chat bubble.
Slack Alert & Telegram Alert
Simple HTTP posts to a Slack webhook or a Telegram bot. Pick your team’s poison.
Email Alert
A classic SMTP send for shops that live in their inbox.
Build HTML Email → Gmail
My favorite of the bunch. Build HTML Email renders the incident report into a proper, responsive HTML email — a severity-colored header (red for critical, green for low), a clean metadata table (agent, source IP, country, MITRE, VirusTotal, AbuseIPDB), and the AI's report in a tidy panel. Then the Gmail node sends it. It lands looking like something a real SOC platform would email you, not a wall of plaintext.
Stage 7 — The paper trail
TheHive Enabled? → Create TheHive Alert
If you run TheHive for case management, flip the toggle and every incident automatically becomes a case there — title, description (the AI report), severity, and the source IP attached as an observable. If you don’t use TheHive, it’s off by default and stays out of your way.
Build Log Entry → Log to Google Sheets
For everyone else, there’s the humble spreadsheet. Build Log Entry flattens the incident into a clean row — timestamp, agent, IP, rule, MITRE, scores, threat level, a snippet of the AI report — and Log to Google Sheets appends it. Instant, searchable incident history with zero infrastructure. Honestly underrated.
Stage 8 — The safety net (for when things break)
Every external call can fail. APIs rate-limit you, services go down, certs expire. So there’s a separate little circuit watching the whole thing.
Error Trigger
Catches a failure from any node in the workflow.
Format Error Report
Turns the raw error into something human — which node failed, the message, the time, the execution ID.
Error to Discord
Pings me with that summary so a silent failure doesn’t mean a missed attack. If the workflow trips, I know within seconds.
The stuff that actually got me stuck (because it’s never this clean)
The diagram makes it look smooth. Reality involved a lot of squinting at error messages:
Cloudflare
526and1003. My Wazuh sat behind Cloudflare, which happily proxies port 443 but not 9200 or 55000. The fix wasn't credentials — it was realizing the indexer needed a path Cloudflare wasn't in.ECONNREFUSED. Turned out my indexer wasn't listening on its public IP at all — it was on a private192.168.xaddress.nc -vzfrom inside the container was the hero that proved it.socket hang up. Classic "I sent plain HTTP to a TLS-only port." Wazuh's indexer is HTTPS-only with a self-signed cert, so the node needshttps://and "Ignore SSL Issues" turned on.The notification that went nowhere. I’d literally set my channel to
"gmail | discord"— pasting the menu as the value. The switch matched nothing. Lesson: read your own dropdowns.
None of these were the workflow’s fault. They were the gap between “works in a diagram” and “works on real infrastructure” which is exactly the gap this kind of project teaches you to close.
Get the Workflow
The AI SOC Analyst L1 — For Wazuh SIEM is available now on my stores as a ready-to-import n8n JSON with full setup documentation.
👉 Get it from — Here
Make it yours
If you build something like this, please do two things:
Leave dry-run on until you trust it. Watch what it would do for a week before letting it touch a firewall.
Keep an analyst in the loop. This is a tier-1 force multiplier, not a replacement. It triages the 400 alerts so the human can focus on the 3 that matter.
That’s the whole machine, every node, end to end. It took a weekend to build and a frustrating afternoon of networking to actually connect, but now it reads my alerts before I do and writes better incident reports than I do at 2 a.m.
If you want me to share the workflow JSON or go deeper on any single stage, let me know in the comments. Happy hunting.
Built with n8n, Wazuh, Ollama, VirusTotal, and AbuseIPDB. Self-hosted, dry-run-safe, and quietly judging every IP that knocks on my door.