One Wazuh, Many Clients: Why I Built a Multi-Tenant Wazuh Dashboard
2026-07-21 · NeetroX
If you run Wazuh for more than one client, you already know the awkward secret: there’s no good way to let them look at it.
Wazuh is a genuinely excellent open-source SIEM. It collects everything, detects plenty, and costs nothing. But the moment you manage security for multiple companies from one installation, you hit a wall the dashboard shows everything to everyone. Client A’s brute-force attempts sit right next to Client B’s vulnerability list, and your own infrastructure’s alerts are sprinkled in between.
So you do what every MSP does. You screenshot panels into a monthly PDF, or you give clients a nervous read-only login and hope they never click the wrong filter.
I didn’t like either option. So I built a multi-tenant Wazuh dashboard: a self-hosted layer that sits on top of an existing Wazuh installation and gives every client their own isolated, branded SOC console. In this post I’ll walk through why Wazuh can’t do this out of the box, the architecture that makes it work, and the three design decisions that mattered more than I expected.
Why Wazuh Can’t Just Do This
Here’s the thing most people discover too late: multi-tenancy in Wazuh isn’t a missing feature you can toggle on. It’s an architectural gap.
Wazuh organizes agents into groups, so far so good. You can put Client A’s servers in one group and Client B’s in another. The problem starts when you look at the data itself: the alert and vulnerability documents that land in the Wazuh Indexer don’t carry group membership. An alert knows which agent fired it, but not which client that agent belongs to.
That means index-level access control can’t cleanly separate tenants. You’d need per-client index patterns, custom label configuration on every agent, and a pile of OpenSearch role mappings that break the day someone forgets to label a new agent.
And even if you solved all that, you’d still be handing your clients the Wazuh interface an analyst’s tool, with your other customers’ group names visible in every dropdown.
The conclusion I landed on: don’t fight the Wazuh UI. Put a purpose-built layer in front of it.
The Architecture: Never Touch the SIEM
My tool follows one rule everywhere: read-only over Wazuh. The SIEM is the source of truth, and nothing in the dashboard stack ever writes to it.
The pipeline looks like this:
An ingest worker (TypeScript, running as its own container) pulls from the Wazuh Indexer and Manager API every 5 minutes.
It aggregates the raw events into pre-computed snapshots in Postgres alert volumes, severity breakdowns, top rules, MITRE tactics, vulnerability counts one set per client group.
A thin Fastify read-API serves those snapshots as JSON.
A React + ECharts dashboard renders them as a dark SOC console that auto-refreshes every 60 seconds.
The whole thing ships as a single docker-compose.yml Postgres, ingest, API, and web in four containers. Configuration is one .env file: your Wazuh credentials, your branding, your admin login. No hardcoded secrets, no per-client config files.
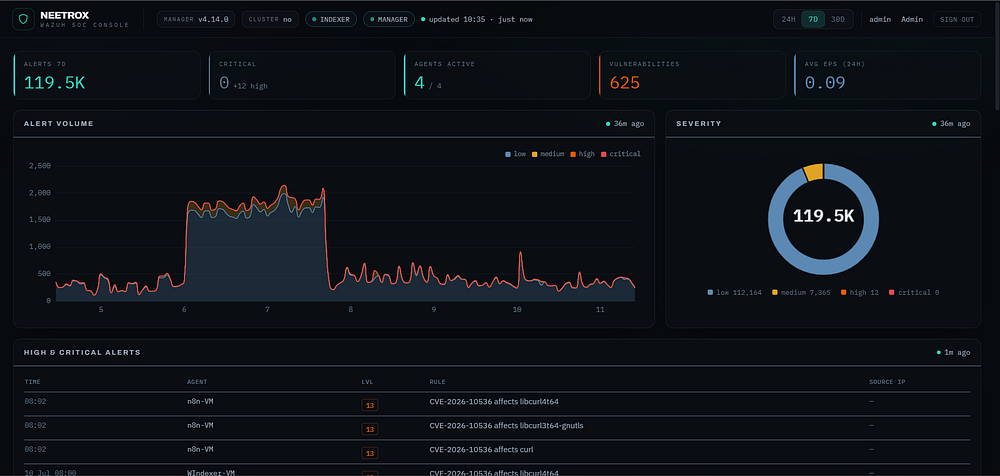
It’s also deliberately lightweight. There’s no Elasticsearch cluster of its own, no Grafana, no Kafka the heaviest thing in the stack is a plain Postgres holding pre-aggregated numbers. The API is a thin Fastify service, the frontend is static files behind nginx, and the ingest worker sleeps between five-minute cycles. You can run the entire stack comfortably on a small VM alongside other workloads; your Wazuh servers will always be the big machines in the room, not this.

Why snapshots instead of querying Wazuh live? Two reasons. First, load isolation: twenty clients refreshing dashboards would hammer your Indexer; with snapshots, Wazuh answers a handful of aggregation queries every five minutes no matter how many people are watching. Second, blast radius: if the dashboard stack has a bad day, your SIEM doesn’t even notice.
Video Demo
Multi-Tenancy Is a Data-Scoping Problem, Not a UI Problem
This is the part I’d tell anyone building something similar: tenant isolation that lives in the frontend is not isolation. It’s decoration.
In my solution, every user session is a signed JWT that carries the client’s Wazuh groups, stored in an httpOnly cookie. When a request hits the API, a single choke point resolves the session’s groups and parameterizes every query with them. The browser never gets to say which tenant it wants to see it can’t, because there’s no parameter for it. Tampering with requests gets a client exactly what they already had: their own data.
Remember that gap I mentioned alerts not knowing their group? The ingest worker solves it at collection time. It asks the Manager API which agent IDs belong to each group, then filters alerts and vulnerabilities by agent.id before writing snapshots. Scoping stays correct even with zero label configuration on the agents.
The payoff: adding a tenant is a database row, not an infrastructure project. The worker auto-discovers clients from the clients table and runs one ingest pass per group.
The Three Decisions That Mattered Most
1. New clients start with zero panels
The dashboard has 17+ visualizations alert volume, severity, MITRE ATT&CK treemaps, compliance coverage, a world geolocation map, file integrity monitoring, and more. A new client sees none of them until an admin explicitly grants each one.
That sounds like friction. It’s actually the feature MSPs need most: different clients pay for different service tiers, and least-privilege defaults mean you can never accidentally overshare. In the admin console it’s a checklist - tick what this contract includes, save, done.
2. White-labeling is per-client, not per-install
The product name and subtitle are build-time settings, so the login screen carries your brand. But each client’s display name comes from the database at runtime. When Company A signs in, the console header says Company A not your tool’s name, and certainly not Wazuh’s.
Small detail, big perception shift: clients don’t feel like they’re borrowing your internal tooling. They feel like they have their own SOC.
3. Onboarding has to be instant, or admins won’t trust it
A five-minute ingest cycle sounds fine until you’re onboarding a client on a call and staring at empty panels. So creating or editing a client fires a Postgres NOTIFY; the ingest worker holds a dedicated LISTEN connection and runs that group immediately. Panels populate in seconds, and the scheduled cycle remains the backstop if the notification ever fails.
In my test environment, the gap between “create client” and “populated dashboard” was shorter than the time it took to create their login.
Honest Dashboards Beat Pretty Ones
One more design principle worth stealing, whatever you’re building: never render a lie.
Security dashboards have a nasty failure mode a chart that silently shows stale or partial data. Someone makes a decision based on it, and now the pretty UI has done actual harm. This Tool handles this with what I think of as aggressive honesty:
Every panel shows a freshness timestamp with a color-coded dot fresh, aging, or stale.
The header shows per-source health pills for the Indexer and Manager, plus a stale badge if two ingest cycles are missed.
If a Wazuh module is disabled say, the Vulnerability Detector or MITRE enrichment, the panel shows a labelled placeholder explaining exactly that, instead of an empty chart pretending everything’s fine.
On a fresh install, the whole dashboard says “no data yet” in seventeen polite ways. Five minutes later it’s full. Both states are true, and that’s the point.
What It Looks Like in Practice
The end-to-end flow, from my own deployment:
Copy
.env.exampleto.env, fill in Wazuh credentials and branding about two minutes.docker compose up -d --buildabout one minute.Sign in as admin, open the admin console, create three clients mapped to my existing Wazuh agent groups, Company A, Company B, and my own infrastructure, each with its own panel set.
Create a login for each client.
Sign in as a client: their name in the header, their agents’ alerts in the charts, a 24-hour / 7-day / 30-day range selector, and nothing that belongs to anyone else.
Long ranges work immediately, by the way, the 7-day and 30-day snapshots aggregate straight from the existing Wazuh indices, so clients get a month of history on day one, not thirty days after install.
Should You Build or Buy This?
If you’re a strong TypeScript team with spare capacity, you now have the blueprint: read-only ingest, per-group snapshots, session-scoped queries at one choke point, least-privilege panels, instant onboarding via LISTEN/NOTIFY. Honestly, the architecture is the easy 20%. The long tail graceful degradation for every disabled module, retention windows, self-healing schema migrations, serialized ingest runs, is where the months go.
If you’d rather skip those months: This is exactly that, packaged. Full source code, self-hosted on your own infrastructure, one compose stack light enough for a small VM, no vendor lock-in and no per-seat fees. You can get it at neetrox.com
Either way, the takeaway stands: your Wazuh already collects everything your clients would love to see. The only thing missing is a safe window to look through and that’s a solvable, well-shaped problem.
What’s your setup for client-facing Wazuh reporting today PDFs, shared logins, or something you built yourself? I’d genuinely like to hear how others have solved this. Drop a comment.